The Statistics window gives the operator a current reading of relevant numerical information.
Statistics Window Items
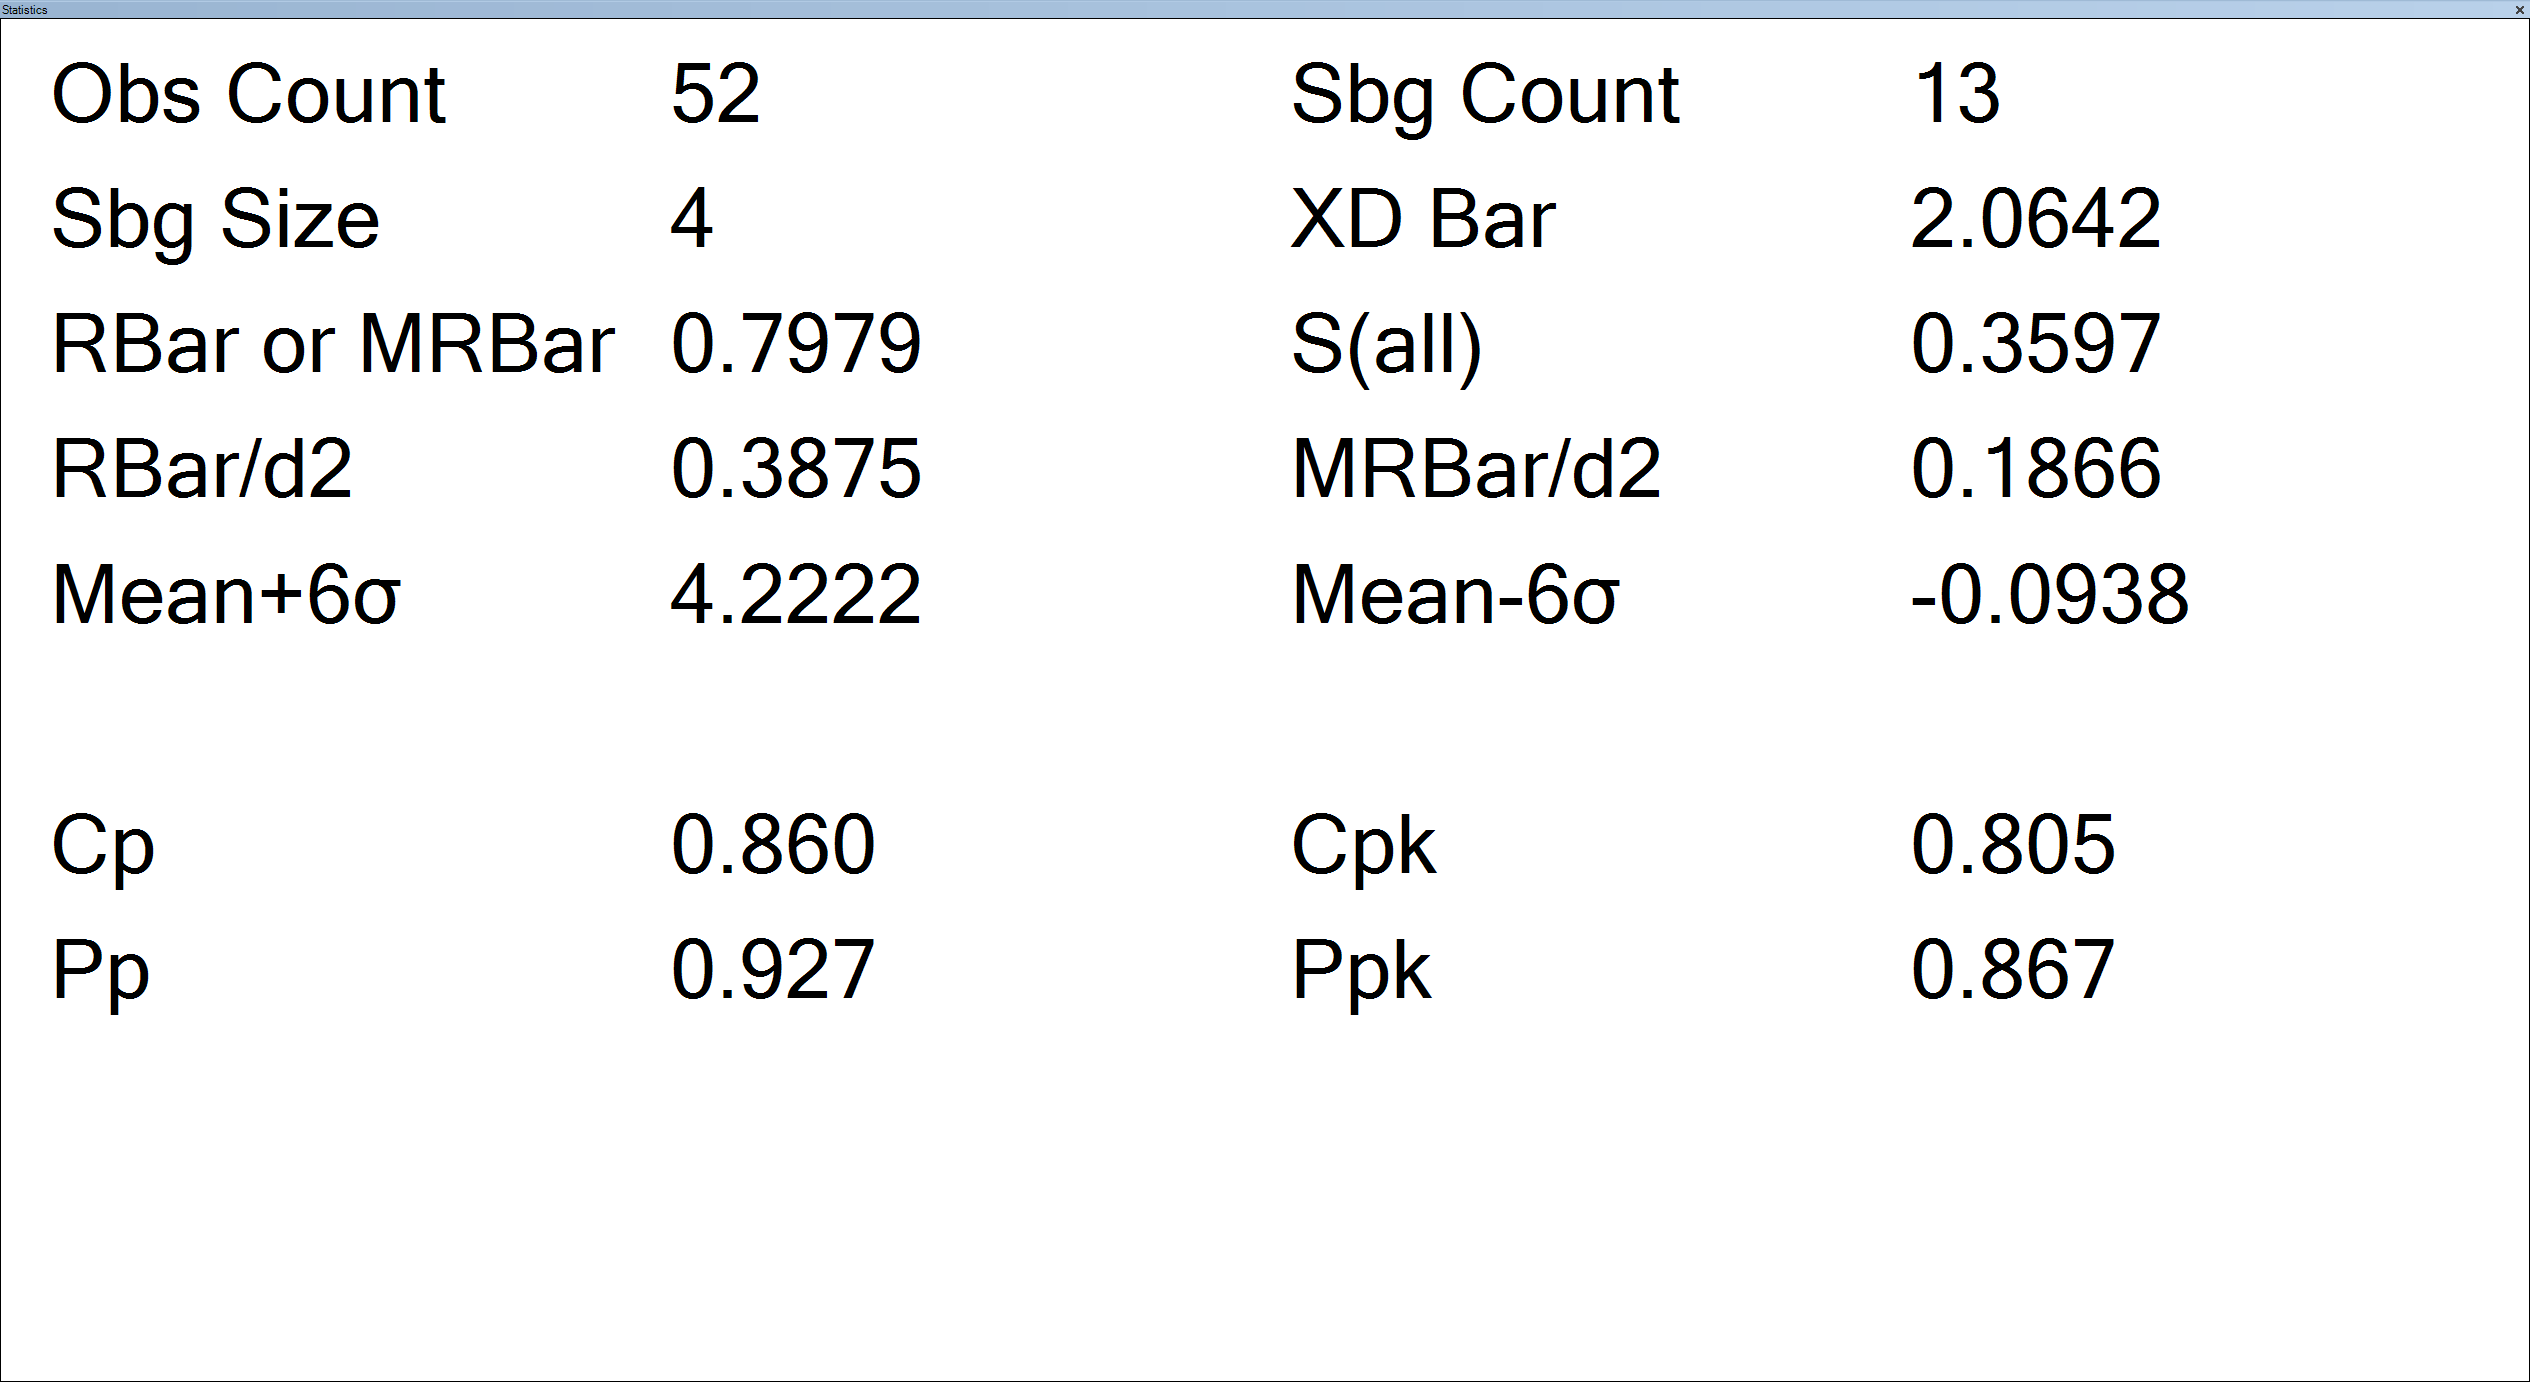
The Statistics window gives the operator a current reading of relevant numerical information.
The following items will be found in the Statistics window:
Subgroup number (k).
n = ObsCnt = Observation Count = number of individual observations made.
XDBar = = X -double bar = the mean of the subgroup averages.
Rbar = average of the subgroup ranges.
s (all) = s
s =
= current standard deviation of inspection run
RBar/d2 = estimated standard deviation
Min = minimum observation value
Max = maximum observation value
Mean +/- 3,4,6s = control limits for XBar chart
Defect Ratio = percentage of measurements outside of tolerance
PPM = parts per million outside of tolerance
Cp = potential process capability index = (UTL-LTL)/6s where s = RBar/d2 Learn More
Cpk = potential process performance index = Zmin/3 where Zmin = min {(UTL – )/s, ( – LTL)/s}, where s = RBar/d2 Learn More
CR = capability ratio = 1/Cp
CPL = ( – LTL)/3s, where s = RBar/d2
CPU = (UTL – )/3s, where s = RBar/d2
Pp = actual process capability index = (UTL-LTL)/6s, where s =
Ppk = actual process performance index = Zmin/3 where Zmin = min {(UTL – )/s, ( – LTL)/s}, where s =